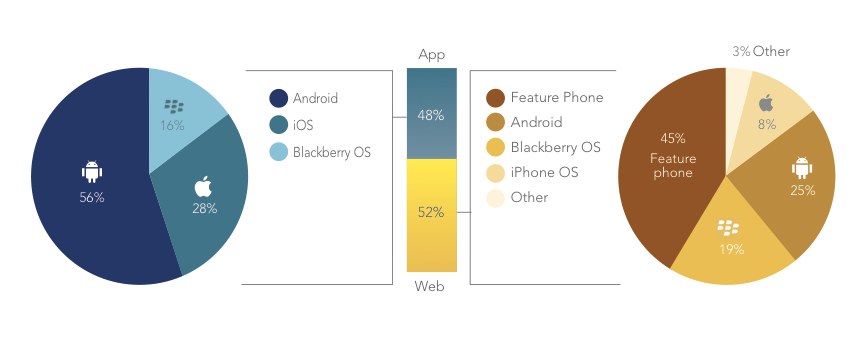
 The latest monthly figures from independent mobile ad network Jumptap reveal that Android has continued to solidify its lead as the most dominant mobile operating system, leading not only in market share but also as the top smartphone platform for both app and mobile web usage. But we can also still see why advertising on the iOS platform comes at a premium: click-through rates remain the highest of all on Apple’s mobile platform. Meanwhile, the ad network also crunched its numbers to produce some revealing numbers on how Amazon’s breakthrough tablet, the Kindle Fire, is selling in different U.S. cities. Jumptap, in its latest MobileStat report, notes that Android had once again widened the lead between it and the next-closes smartphone platform in terms of popularity. In November it accounted for 52.7 percent share of the 95 million unique monthly visitors to which Jumptap served ads in the month. That is up from 44.7 percent in October, and well ahead of Apple’s 22.1 percent. For all the woe piled on RIM (NSDQ: RIMM), BlackBerry’s share of the market was nearly level with iOS, with 20.9 percent. Symbian, at 3.2 percent, is still bigger than Windows Phone 7, which was level with WebOS at 0.5 percent. Given the platform’s ubiquity, Android’s domination also shined through in terms of data consumption on its devices. Android led in app usage at 56 percent (again, growing from 49 percent the month before), and was the biggest smartphone platform in terms of mobile web access, at 25 percent—but feature phones like the one pictured above, which largely do not use apps (although that is changing) still outshone it in the latter category, with a 45 percent of all traffic. 
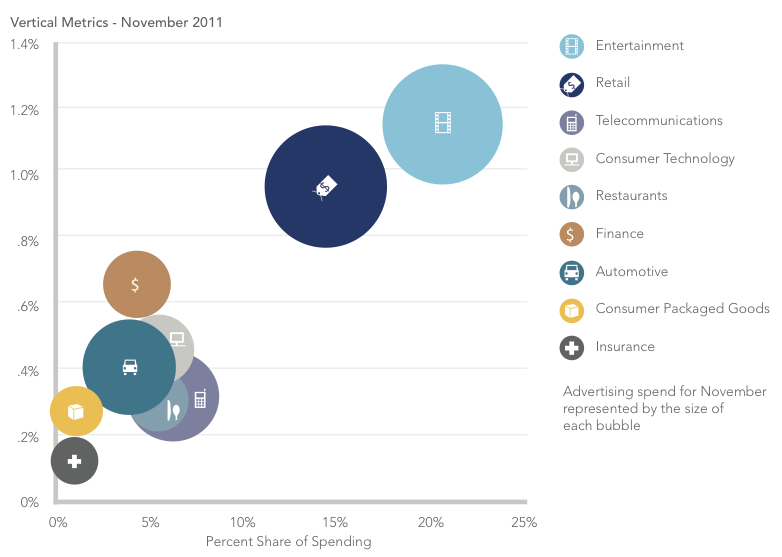
That’s all fine and well, but Apple’s iOS is still leading when it comes to interactivity on ads that run on its devices, a sign of perhaps more engagement on the platform, and perhaps a more tactile experience in the content itself. Many developers do, after all, still put iOS first on their list of platforms when presenting their best and most enhanced work. iOS had click-through rates of 0.72 percent, well above the average of 0.65 percent. Also notable is how well Symbian performed compared to the others: http://paidcontent.org/images/editorial/_original/jumptap-nov-2011-ctrs-o.png In terms of how different verticals fared in mobile advertising, Jumptap says that entertainment and retail had the highest CTRs, and also saw the biggest spend from brands in November 2011. Not surprising, considering that both sectors would have been gearing up for the holiday spending rush and getting consumers aware of films, TV and other entertainment to consume over the holiday break. 
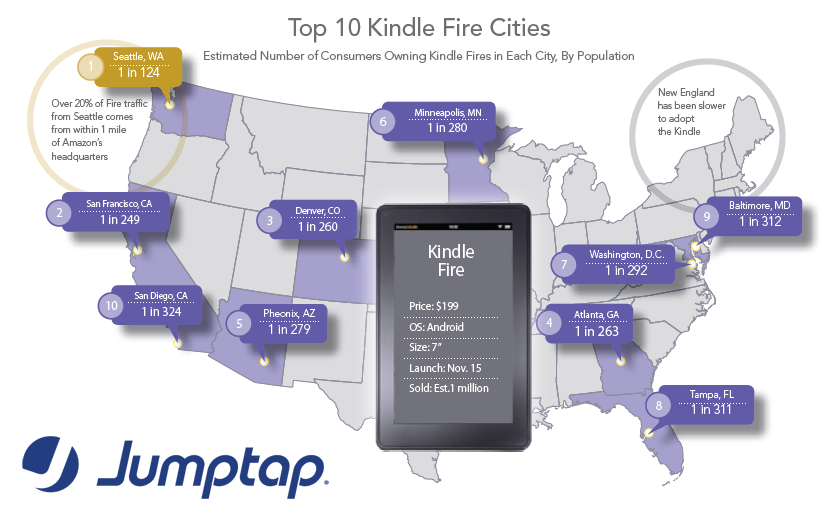
And in the ongoing absence of hard data from Amazon (NSDQ: AMZN) about exactly how many Kindle Fire tablets it has sold since launching the product late last year, Jumptap has waded in with its own number-crunching. Using data from its ad network, which is able to detect what kind of device is pulling down ads from Jumptap’s ad network, it came up with Kindle Fire penetration rates in different U.S. cities. Perhaps unsurprisingly, Seattle, home of Amazon, accounted for the most Kindle Fire traffic of all, with one device for every 124 people. Not clear if that’s a sign of Amazon employees clicking away, or some consumer support for the home team. San Francisco—one device for every 249 people—had the second-highest penetration for the Kindle Fire—again, not too much of a surprise given that it is in the heart of the tech capital of the world. (Full map appears at the bottom of the post.) Jumptap notes that while numbers appear to be growing fast—Kindle Fire traffic on its network grew by 270 percent in November—“it’s still nowhere near the iPad in traffic.” Time (NYSE: TWX) will tell whether it will catch up. 
| 


 AT&T
AT&T Continental
 Lucky Minutes
 Bizon
Bizon Partner
 Simply
 Jupiter
 Solaris